
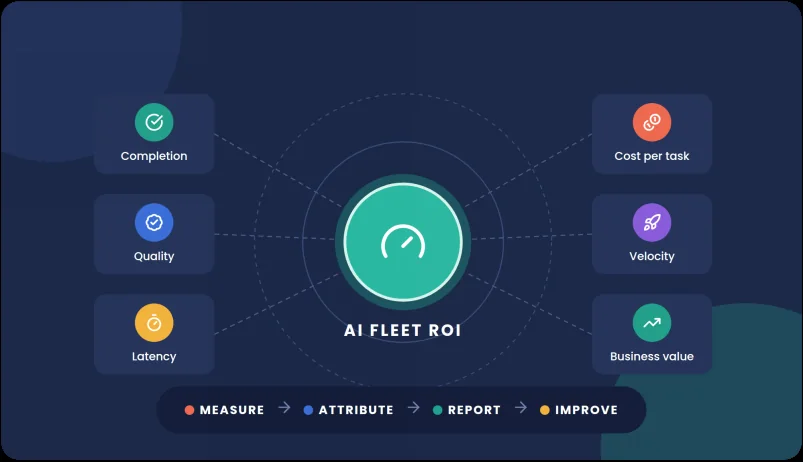
Measuring ROI: Key Metrics to Track Your Agentic Automation Fleet
Moving beyond hours saved to quantify unit economics, error reduction, speed-to-market and autonomous throughput.
Once a team has a few AI agents running in production, a new question lands on the leadership agenda: is this actually paying off? The first answer is usually a slide that says the agents 'saved 1,200 hours last quarter'. It sounds impressive, but nobody can say where those hours went, what they were worth, or what the agents cost to run.
This is Part 7 of our 8-part series, The Autonomous Enterprise. In Part 6, Human-in-the-Loop (HITL), we designed the approval gates that keep agents safe. Now we turn to the scoreboard: how to measure AI automation ROI with metrics that a CFO, a marketing lead and an engineer can all trust.
We will cover the core agentic AI metrics for a fleet of agents, a simple formula for unit economics (token cost versus task value), a fully worked example, velocity measures such as speed-to-market, and a ready-to-use executive dashboard template.
▬▬
Why 'Hours Saved' Is a Vanity Metric
Hours saved is the most common way to report automation value, and the least useful. It assumes every minute an agent handles would otherwise have been spent productively by a person, at full cost, with the same quality. In reality, freed-up time is often absorbed by other work, and nobody books it as a saving.
Hours saved also hides the costs. It ignores tokens, tool calls, infrastructure, the human reviewers from your HITL gates, and the engineers who maintain prompts and integrations. It says nothing about quality, so an agent that is fast but wrong looks like a winner.
| Vanity metric A number that grows easily and looks good on a slide, but cannot be tied to cost, quality or revenue. Example: total hours saved, total tasks run. | Value metric A number tied to an outcome the business already pays for, net of every cost. Example: fully loaded cost per completed invoice, error rate, days to launch. |
|---|
Value metrics connect agent activity to cost, quality and speed, while vanity metrics only count activity.
The fix is not to abandon time savings, but to put them in context. Time is one input to value. To understand the business value of AI agents, you need to measure what the agent produced, how well it produced it, how fast, and at what fully loaded cost.
▬▬
Core AI Fleet KPIs: What to Measure for Every Agent
A good measurement system works at two levels. At the agent level, it tells an operator whether a single workflow is healthy. At the fleet level, it rolls those numbers up so leaders can compare workflows and decide where to invest next. The AI fleet KPIs below work at both levels.
Agentic AI metrics build on each other: reliable performance data supports quality, cost and velocity measures, which together explain business value.
1 Task Completion Rate
The AI task completion rate is the share of tasks an agent finishes correctly. Split it in two. Autonomous completion counts tasks finished with no human touch. Assisted completion adds tasks that needed human approval before they were done.
The gap between the two numbers tells you how much your HITL gates are doing. If autonomous completion is 60% and assisted completion is 95%, the agent is useful but leaning heavily on reviewers. That is fine early on, but it should narrow as confidence thresholds are tuned.
2 Error Rate and Quality
Quality is where agents often create the most value, and where it is most often left unmeasured. Track the error rate of agent outputs against the error rate of the process before the agent existed. For data processing, an error can be a wrong field, a duplicate CRM record, or a mis-tagged support ticket.
Measure it by sampling. Each week, have a reviewer audit a random sample of completed tasks, say 50 to 100, and record the errors found. Combine this with downstream signals, such as invoices rejected by the ERP or records merged later in Salesforce or HubSpot.
Measured against a sampled manual baseline, error reduction in automated data processing is often a bigger source of value than labour time (illustrative figures).
3 Latency and Throughput
Latency is how long one task takes from trigger to completion. Throughput is how many tasks the fleet completes per hour or per day. Report the median and the 95th percentile for latency, because averages hide the slow tail that frustrates users.
Include human wait time in end-to-end latency. An agent that drafts a reply in eight seconds but then waits four hours for a Slack approval has a four-hour cycle time, and that is what the customer feels.
4 Escalation and Intervention Rate
This is the share of tasks routed to a human, either by a confidence gate or after a failure. Split it into planned escalations (the HITL design working as intended) and unplanned ones (errors, timeouts, broken tools).
Rising unplanned escalations are an early warning. They often mean an upstream API changed, a prompt drifted, or the inputs shifted. In Part 5, Self-Correction in Action, we showed how retries and circuit breakers contain these failures; this metric tells you how often they fire.
5 Cost per Completed Task
Finally, every agent needs a single cost number: total spend divided by tasks completed. It is the bridge between operations and finance, and the foundation of unit economics in the next section.
| KPI | How to calculate | Why it matters |
|---|---|---|
| Autonomous completion rate | Tasks done with no human touch ÷ tasks attempted | Shows true autonomy |
| Assisted completion rate | Tasks done incl. approvals ÷ tasks attempted | Shows useful output |
| Error rate | Errors in audited sample ÷ sample size | Measures quality vs baseline |
| Median / p95 latency | Trigger-to-done time, incl. human waits | Reflects user experience |
| Escalation rate | Tasks routed to humans ÷ tasks attempted | Tracks HITL load and drift |
| Retry rate | Extra model runs ÷ tasks attempted | Reveals hidden token spend |
| Cost per completed task | Total fully loaded cost ÷ tasks completed | Links operations to finance |
| Instrument before you launch. Log a task ID, start and end times, token counts, tool calls, retries and the final outcome for every run from day one. Tools such as LangSmith, Langfuse or an OpenTelemetry pipeline make this straightforward, and you cannot rebuild missing history later. |
|---|
▬▬
Unit Economics: Token Cost vs Task Value
Unit economics answers one question: does each completed task create more value than it costs? It is the most honest way of calculating AI agent ROI, because it scales cleanly. If one task is profitable and quality holds, a thousand tasks are too.
1 The Formula
Start with the model cost of a single run, then build up to a fully loaded cost per task and compare it with the value of that task:
• Model cost per run = (input tokens × input price + output tokens × output price) ÷ 1,000,000, with prices quoted per million tokens
• Model cost per task = model cost per run × average runs per task (to include retries and reflection loops)
• Fully loaded cost per task = (model cost + tool and API cost + infrastructure + human review + manual fallback + maintenance) ÷ tasks completed, counting fallback tasks because their cost is included
• Value per task = baseline cost of doing the task without the agent + value of errors avoided + any revenue or speed gains you can attribute
• Unit margin = value per task − fully loaded cost per task
• ROI = (total value − total cost) ÷ total cost, over a defined period that includes build cost
| ● Model cost Input and output tokens at your provider's per-million prices, multiplied by runs per task. | ● Tool cost Paid API calls such as OCR, enrichment, search or email sends. | |
|---|---|---|
| ● Infrastructure Orchestration, vector database, logging and hosting, spread across tasks. | ● Human review Reviewer minutes for HITL approvals, at a fully loaded hourly rate. | |
| ● Fallback The cost of tasks the agent could not finish and a person completed. | ● Maintenance Engineering time for prompts, evals, integrations and monitoring. |
2 A Worked Example: Invoice Processing
The following numbers are illustrative, chosen to show the method rather than to describe any real company or model. A finance team runs an agent that reads supplier invoices, extracts the fields, matches them to purchase orders and posts them to the ERP. It handles 10,000 invoices a month.
Each run uses about 12,000 input tokens and 1,500 output tokens. Assume a model priced at $3 per million input tokens and $15 per million output tokens. One run costs (12,000 × $3 + 1,500 × $15) ÷ 1,000,000 = $0.036 + $0.0225 = $0.0585. Retries and a self-check pass average 1.2 runs per invoice, so model cost per invoice is $0.0585 × 1.2 = $0.0702.
Of the 10,000 invoices, 8,900 complete with no human touch, 800 are routed to a reviewer by the confidence gate and then completed, and 300 fail and fall back to manual handling. Before the agent, a clerk spent 6 minutes per invoice at a fully loaded $40 per hour, which is $4.00 per invoice. A review takes 3 minutes, or $2.00.
| Monthly cost line | Calculation | Cost |
|---|---|---|
| Model tokens | 10,000 × $0.0702 | $702 |
| Tool and API calls | 10,000 × $0.01 | $100 |
| Infrastructure (fixed) | Orchestration, logs, storage | $800 |
| Human review | 800 × $2.00 | $1,600 |
| Manual fallback | 300 × $4.00 | $1,200 |
| Maintenance | Engineering and monitoring time | $4,000 |
| Total operating cost | Sum of the lines above | $8,402 |
Fully loaded cost per invoice is $8,402 ÷ 10,000 = $0.84. On the value side, the avoided manual cost is 10,000 × $4.00 = $40,000. Quality adds more: the manual process had a 2% error rate (200 errors) and the agent with HITL has 0.5% (50 errors). At $25 of rework per error, that is $5,000 − $1,250 = $3,750 avoided. Total monthly value is $43,750, or about $4.38 per invoice.
Net monthly benefit is $43,750 − $8,402 = $35,348. With a one-off build cost of $60,000, payback is $60,000 ÷ $35,348 ≈ 1.7 months. Over the first year, total value is 12 × $43,750 = $525,000 and total cost is $60,000 + 12 × $8,402 = 525,000 − $160,824) ÷ $160,824 ≈ 226%.
In the illustrative invoice example, the token cost of a task is about 1.6% of its value; the fully loaded cost of $0.84 still leaves a value-to-cost ratio of about 5.2×.
3 What the Numbers Reveal
The surprise for most teams is how small the token line is. In this example, tokens are $702 of $8,402, or about 8% of operating cost. Human review, fallback and maintenance make up roughly 81%. The debate about token cost vs productivity is real, but the bigger levers are usually autonomy and maintenance effort.
That shapes LLM cost management. Cutting the token bill in half saves $351 a month here. Moving 400 of the reviewed invoices to straight-through processing, by improving extraction quality, saves $800. Use cheaper models for simple steps, prompt caching and batch pricing where your provider offers them, but measure the whole cost stack first.
| Measure value, not just savings. If you only count avoided labour, you will undervalue agents that improve quality or speed. Put a price on rework, late payments and missed launch windows, and document the assumption so finance can challenge it. |
|---|
▬▬
Financial Metrics: Agents vs Human Labour vs Traditional SaaS
Leaders rarely ask whether an agent is cheap in isolation. They ask whether it is cheaper or better than the alternatives: doing the work by hand, buying a specialized SaaS tool, or using classic rule-based automation such as UiPath or Zapier. Comparing the cost structure of each makes the trade-offs clear.
| Dimension | Human team | Traditional SaaS / RPA | Agentic AI fleet |
|---|---|---|---|
| Cost model | Salary per person | Licence per seat or bot | Usage per task plus fixed infra |
| Scales with volume | Linearly, with hiring lag | Well, for fixed rules | Well, within rate limits |
| Handles messy input | Yes | Poorly | Yes, with validation |
| Change cost | Training time | Developer rework | Prompt and eval updates |
| Hidden costs | Turnover, errors | Brittle scripts, upkeep | Review, retries, monitoring |
| Best metric | Cost per task, error rate | Cost per task, failure rate | Fully loaded cost per task |
The key is to use the same unit for all three: fully loaded cost per completed task at a given quality level. Per-seat SaaS often looks cheaper on paper, but if a person still has to clean up its output, that labour belongs in the comparison too.
Watch the shape of the cost curve as well. Human cost rises in steps as you hire. Licence cost rises with seats. Agent cost rises smoothly with volume, which makes it easier to forecast, as long as you track cost per task every month and set budget alerts.
▬▬
Velocity Metrics: Speed-to-Market and Iteration Cycles
Some of the largest returns from agents do not show up as cost at all. They show up as speed. A campaign that launches in days rather than weeks captures demand sooner; a quote sent in minutes rather than a day is more likely to win.
Consider an illustrative marketing ops example. Before agents, launching a regional email campaign took about three days: drafting copy, building segments in HubSpot, creating variants, QA and approvals. With a multi-agent pipeline, the build steps take around five minutes once the brief is approved, and the remaining time is a human sign-off in Slack.
Brief approved → Copy and variants drafted → Segments built → QA agent checks → Human sign-off → Campaign live
Velocity is measured end to end: track the time from brief to live campaign, not just how fast the agent drafts copy.
Useful velocity metrics include cycle time (request to be done), time to first draft, queue time (how long work waits for a human), and iterations per week (how many versions a team can test). Iteration speed matters because it compounds: a team that tests ten subject lines a week learns faster than one that tests two.
▬▬
The Executive ROI Dashboard: A Reporting Template
Executives need one page that answers four questions: how much is the fleet doing, how well, how fast, and what is it worth after costs. Build it in the BI tool you already use, such as Looker, Power BI, Tableau or Metabase, fed by the run logs you instrumented earlier.
An executive dashboard shows total autonomous fleet output alongside quality, cost and net value, with a trend line that proves improvement over time (illustrative values).
Use the template below as a starting point. Each row should have a named owner and a review cadence, so the dashboard drives decisions rather than decorating a meeting. The illustrative values follow the invoice example above.
| Dashboard metric | Definition | Illustrative value | Review |
|---|---|---|---|
| Total fleet output | Tasks completed by agents | 9,700 / month | Weekly |
| Autonomous completion | No-touch tasks ÷ attempted | 89% | Weekly |
| Assisted completion | Completed incl. approvals ÷ attempted | 97% | Weekly |
| Error rate vs baseline | Audited errors ÷ sample | 0.5% vs 2.0% | Weekly |
| Median cycle time | Trigger to done, incl. waits | 3.2 min | Weekly |
| Cost per completed task | Fully loaded cost ÷ all tasks done | $0.84 | Monthly |
| Token share of cost | Token spend ÷ total cost | 8% | Monthly |
| Net monthly value | Total value − total cost | $35,348 | Monthly |
| Payback / ROI | Build cost ÷ net value; year-one ROI | 1.7 months / 226% | Quarterly |
A good dashboard also shows the fleet by workflow. A simple table of agents ranked by net value and error rate tells leaders where to scale next and which agents need attention.
| ✓ One fully loaded cost per task | ✓ Net value, not gross savings |
|---|---|
| ✓ Autonomous and assisted rates shown separately | ✓ Trend over at least three months |
| ✓ Error rate against a manual baseline | ✓ Breakdown by workflow and owner |
| ✓ Latency including human wait time | ✓ Assumptions documented and dated |
| Show the assumptions. Put the hourly rates, error costs and token prices you used on the dashboard itself. When finance can see and adjust the assumptions, the numbers become a shared tool instead of a sales pitch. |
|---|
▬▬
Common Mistakes When Measuring AI Efficiency
Measuring AI efficiency is a new discipline for most teams, and the same errors appear again and again. Most come from counting the easy numbers and skipping the uncomfortable ones.
| ✗ Reporting hours saved without costs | ✗ No pre-agent baseline to compare |
|---|---|
| ✗ Counting attempted tasks as completed | ✗ Averages without p95 latency |
| ✗ Ignoring human review time | ✗ Claiming revenue without attribution |
| ✗ Leaving maintenance out of cost | ✗ Tracking tokens but not retries |
The most damaging mistake is having no baseline. If you did not measure the manual error rate or cycle time before the agent went live, every later comparison is a guess. Spend a week or two sampling the current process first, even roughly; it will pay for itself in credibility.
▬▬
Conclusion
Proving AI automation ROI is not about bigger numbers on a slide. It is about a small set of honest metrics: completion rate, error rate, latency, escalation rate and fully loaded cost per task, rolled up into unit economics that compare token cost with task value.
When you measure this way, the conversation changes. Instead of debating whether AI agents are worth it, teams can see which workflows earn their keep, which need tuning, and where the next agent should go. In Part 8, The Autonomous Enterprise: Building the Scalable Blueprint for Tomorrow's Workforce, we use these numbers to plan how to scale from a few agents to an agent-first organisation.
In simple words: count what the agent completes, check how well it does it, price every cost, and let the net value per task make the case.
▬▬
Frequently Asked Questions
How do you calculate the ROI of an AI agent?
Add up the total value the agent creates over a period, such as avoided manual cost, avoided rework and attributable speed gains. Subtract the total cost, including build cost, tokens, tools, infrastructure, human review, manual fallback and maintenance. Divide the result by total cost to get ROI as a percentage.
What are the most important KPIs for an AI agent fleet?
The core set is autonomous and assisted task completion rate, error rate against a manual baseline, median and p95 latency, escalation rate and fully loaded cost per completed task. Together they show volume, quality, speed and cost, which roll up into net value.
Why is 'hours saved' not enough to measure AI automation ROI?
Hours saved ignores what the agent costs to run, says nothing about quality, and assumes freed time turns into value. It also misses benefits such as fewer errors and faster launches. Fully loaded cost per task and net value give a more accurate picture.
How much of an AI agent's cost is tokens?
It varies by workflow, but tokens are often a smaller share than teams expect. In our illustrative invoice example, tokens were about 8% of monthly operating cost, while human review, fallback and maintenance made up most of the rest. Measure the full cost stack before optimising only the token bill.
How can I reduce LLM costs without hurting quality?
Route simple steps to smaller, cheaper models, use prompt caching and batch pricing where your provider offers them, and cap retries with circuit breakers. Often the bigger saving comes from improving accuracy so fewer tasks need human review or manual fallback.
What should an executive AI dashboard include?
It should show total fleet output, autonomous completion rate, error rate versus baseline, cycle time, cost per completed task and net monthly value, with a trend over several months. Break results down by workflow and owner, and display the assumptions behind any financial figures.
| The Autonomous Enterprise series. This is Part 7 of 8. Previous: Part 6, Human-in-the-Loop (HITL): Balancing Autonomy with Operational Control. Next: Part 8, The Autonomous Enterprise: Building the Scalable Blueprint for Tomorrow’s Workforce. |
|---|
▬▬
SEO Metadata and Schema Markup
Use the following metadata and JSON-LD schema when publishing this article. Replace the placeholder URLs, names, and images with your own before adding the script to the page head. The visible FAQ section above matches the FAQPage schema, which search engines require.
Metadata
Focus keyword: AI automation ROI
Secondary keywords: agentic AI metrics, AI fleet KPIs, measuring AI efficiency, token cost vs productivity, AI task completion rate, LLM cost management, calculating AI agent ROI, business value of AI agents
SEO title (54 characters): AI Automation ROI: Key Metrics for Your AI Agent Fleet
Meta description (157 characters): Measure AI automation ROI with the right agentic AI metrics: task completion, error rate, cost per task, unit economics, velocity and an executive dashboard.
URL slug: /ai-automation-roi-agentic-metrics
Series: The Autonomous Enterprise, Part 7 of 8
Word count: 3,272 (approx. 14 minute read)
Schema Markup (JSON-LD)
<script type="application/ld+json">

{

"@context": "https://schema.org",

"@graph": [

{

"@type": "BlogPosting",

"@id": "https://www.yourwebsite.com/blog/ai-automation-roi-agentic-metrics#article",

"mainEntityOfPage": {

"@type": "WebPage",

"@id": "https://www.yourwebsite.com/blog/ai-automation-roi-agentic-metrics"

},

"headline": "Measuring ROI: Key Metrics to Track Your Agentic Automation Fleet",

"alternativeHeadline": "Moving beyond hours saved to quantify unit economics, error reduction, speed-to-market and autonomous throughput.",

"description": "Measure AI automation ROI with the right agentic AI metrics: task completion, error rate, cost per task, unit economics, velocity and an executive dashboard.",

"image": [

"https://www.yourwebsite.com/images/ai-automation-roi-agentic-metrics-hero.webp",

"https://www.yourwebsite.com/images/ai-automation-roi-agentic-metrics-vanity-metrics-vs-value-metrics.webp",

"https://www.yourwebsite.com/images/ai-automation-roi-agentic-metrics-the-agentic-ai-metrics-stack.webp",

"https://www.yourwebsite.com/images/ai-automation-roi-agentic-metrics-error-rate-manual-vs-agent.webp",

"https://www.yourwebsite.com/images/ai-automation-roi-agentic-metrics-unit-economics-tokens-vs-task-value.webp",

"https://www.yourwebsite.com/images/ai-automation-roi-agentic-metrics-measuring-campaign-cycle-time.webp",

"https://www.yourwebsite.com/images/ai-automation-roi-agentic-metrics-autonomous-fleet-monthly-overview.webp"

],

"author": {

"@type": "Person",

"name": "Your Name",

"url": "https://www.yourwebsite.com/about"

},

"publisher": {

"@type": "Organization",

"name": "Your Company Name",

"logo": {

"@type": "ImageObject",

"url": "https://www.yourwebsite.com/images/logo.webp"

}

},

"datePublished": "2026-10-01",

"dateModified": "2026-10-01",

"inLanguage": "en",

"articleSection": "Agentic AI",

"wordCount": 3272,

"keywords": [

"AI automation ROI",

"agentic AI metrics",

"AI fleet KPIs",

"measuring AI efficiency",

"token cost vs productivity",

"AI task completion rate",

"LLM cost management",

"calculating AI agent ROI",

"business value of AI agents"

],

"about": [

{

"@type": "Thing",

"name": "Return on investment"

},

{

"@type": "Thing",

"name": "Agentic AI"

},

{

"@type": "Thing",

"name": "Key performance indicators"

},

{

"@type": "Thing",

"name": "Business process automation"

}

],

"isPartOf": {

"@type": "CreativeWorkSeries",

"@id": "https://www.yourwebsite.com/blog/series/autonomous-enterprise#series",

"name": "The Autonomous Enterprise: Agentic AI Workflows",

"url": "https://www.yourwebsite.com/blog/series/autonomous-enterprise"

},

"position": 7

},

{

"@type": "FAQPage",

"@id": "https://www.yourwebsite.com/blog/ai-automation-roi-agentic-metrics#faq",

"mainEntity": [

{

"@type": "Question",

"name": "How do you calculate the ROI of an AI agent?",

"acceptedAnswer": {

"@type": "Answer",

"text": "Add up the total value the agent creates over a period, such as avoided manual cost, avoided rework and attributable speed gains. Subtract the total cost, including build

cost, tokens, tools, infrastructure, human review, manual fallback and maintenance. Divide the result by total cost to get ROI as a percentage."

}

},

{

"@type": "Question",

"name": "What are the most important KPIs for an AI agent fleet?",

"acceptedAnswer": {

"@type": "Answer",

"text": "The core set is autonomous and assisted task completion rate, error rate against a manual baseline, median and p95 latency, escalation rate and fully loaded cost per completed task. Together they show volume, quality, speed and cost, which roll up into net value."

}

},

{

"@type": "Question",

"name": "Why is 'hours saved' not enough to measure AI automation ROI?",

"acceptedAnswer": {

"@type": "Answer",

"text": "Hours saved ignores what the agent costs to run, says nothing about quality, and assumes freed time turns into value. It also misses benefits such as fewer errors and faster launches. Fully loaded cost per task and net value give a more accurate picture."

}

},

{

"@type": "Question",

"name": "How much of an AI agent's cost is tokens?",

"acceptedAnswer": {

"@type": "Answer",

"text": "It varies by workflow, but tokens are often a smaller share than teams expect. In our illustrative invoice example, tokens were about 8% of monthly operating cost, while human review, fallback and maintenance made up most of the rest. Measure the full cost stack before optimising only the token bill."

}

},

{

"@type": "Question",

"name": "How can I reduce LLM costs without hurting quality?",

"acceptedAnswer": {

"@type": "Answer",

"text": "Route simple steps to smaller, cheaper models, use prompt caching and batch pricing where your provider offers them, and cap retries with circuit breakers. Often the bigger saving comes from improving accuracy so fewer tasks need human review or manual fallback."

}

},

{

"@type": "Question",

"name": "What should an executive AI dashboard include?",

"acceptedAnswer": {

"@type": "Answer",

"text": "It should show total fleet output, autonomous completion rate, error rate versus baseline, cycle time, cost per completed task and net monthly value, with a trend over several months. Break results down by workflow and owner, and display the assumptions behind any financial figures."

}

}

]

},

{

"@type": "BreadcrumbList",

"@id": "https://www.yourwebsite.com/blog/ai-automation-roi-agentic-metrics#breadcrumb",

"itemListElement": [

{

"@type": "ListItem",

"position": 1,

"name": "Home",

"item": "https://www.yourwebsite.com"

},

{

"@type": "ListItem",

"position": 2,

"name": "Blog",

"item": "https://www.yourwebsite.com/blog"

},

{

"@type": "ListItem",

"position": 3,

"name": "The Autonomous Enterprise",

"item": "https://www.yourwebsite.com/blog/series/autonomous-enterprise"

},

{

"@type": "ListItem",

"position": 4,

"name": "Measuring ROI: Key Metrics to Track Your Agentic Automation Fleet",

"item": "https://www.yourwebsite.com/blog/ai-automation-roi-agentic-metrics"

}

]

}

]

}

</script>